Also:
- Partisans shift sharply in trust in government, depending on which party is in the White House
- Doctors, the military, the police, and local schools top the confidence charts
- Congress, AI companies, and Facebook get the lowest confidence ratings
- Those who distrust the federal government also lack confidence in many other American institutions
- Democrats lead generic congressional November ballot by 2 points with registered voters but by 8 points with likely voters
MILWAUKEE — As America reaches the 250th anniversary of the signing of the Declaration of Independence, polling shows that trust in the federal government to do what is right all or most of the time has declined over the long term. Furthermore, while overall levels of trust in the government have not changed much in recent years, partisanship has increasingly shaped levels of confidence. More generally, satisfaction with many institutions, both governmental and nongovernmental, varies widely.
A new Marquette Law School Poll national survey finds that 18% of American adults say they trust the federal government to do what is right all or most of the time, while 19% say they can never trust the government. The remainder, 63%, trust the government only some of the time.
The Marquette Law survey was conducted June 9-15, 2026, interviewing 1,514 adults nationwide, with a margin of error of +/-2.7 percentage points.
The percentage trusting the government all or most of the time has averaged 20.5% across 30 Marquette national polls beginning in 2021. The average saying that they never trust the government is 17.4%, and the average for only some of the time is 62%. The substantial skepticism shown in the results has been a common feature of public opinion since at least 2012, when the Marquette Law School Poll began.
In the late 1950s and early 1960s, trust in the federal government was much higher, and partisan differences in opinion were much smaller. In 1958, 73% said they trusted the federal government all or most of the time, according to polling by the American National Election Study. That percentage fell to 25% in 1980. Except for brief and limited increases in the mid-1980s and late 1990s/early 2000s, trust has remained much lower than it once was.
Unlike in the period before 2000, trust in the government has become substantially dependent on partisanship and which party controls the White House at the time. In Marquette polling during the Biden administration, beginning in 2021, 31% of Democrats trusted the government all or most of the time, compared to 12% of Republicans. Now, in the second Trump administration, beginning in 2025, 31% of Republicans say they trust the government that much, compared to 11% of Democrats.
These partisan discrepancies in trust were much smaller in the past. For example, in 1968, under Democratic President Lyndon Johnson, 65% of Democrats trusted the government, as did 59% of Republicans. And during Republican President Ronald Reagan’s second term in 1988, 48% of Republicans and 35% of Democrats mostly trusted the government. Partisan gaps grew in the 2000s.
The overall stability of trust in recent years masks the changes by partisanship since 2021. Figure 1 shows these trends visually for Republicans and Democrats. The parties moved in opposite directions and almost equal amounts following the change in presidential administration in January 2025.
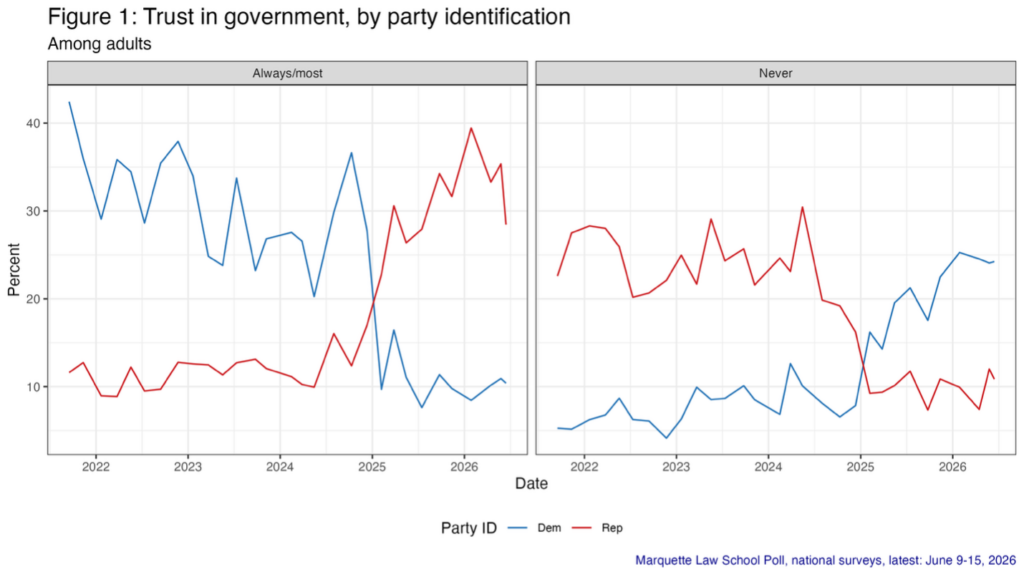
Table 1 provides the numerical values for trust overall and by party since 2021. (All results in the tables are stated as percentages.)
Table 1: Trust in government, by party identification
Among adults
| Poll Dates | Trust Government | |||||||||
| All: Always/most | All: Only some | All: Never | Rep: Always/Most | Dem: Always/Most | Rep: Only some | Dem: Only some | Rep: Never | Dem: Never | ||
| 6/9-16/26 | 18 | 63 | 19 | 28 | 10 | 61 | 65 | 11 | 24 | |
| 5/20-26/26 | 22 | 58 | 21 | 35 | 11 | 53 | 65 | 12 | 24 | |
| 4/8-16/26 | 20 | 60 | 19 | 33 | 10 | 59 | 65 | 7 | 25 | |
| 1/21-28/26 | 22 | 58 | 20 | 39 | 8 | 51 | 66 | 10 | 25 | |
| 11/5-12/25 | 20 | 61 | 19 | 32 | 10 | 57 | 68 | 11 | 22 | |
| 9/15-24/25 | 22 | 64 | 14 | 34 | 11 | 58 | 71 | 7 | 18 | |
| 7/7-16/25 | 18 | 64 | 18 | 28 | 8 | 60 | 71 | 12 | 21 | |
| 5/5-15/25 | 18 | 64 | 18 | 26 | 11 | 63 | 69 | 10 | 20 | |
| 3/17-27/25 | 23 | 63 | 14 | 31 | 16 | 60 | 69 | 9 | 14 | |
| 1/27-2/6/25 | 17 | 70 | 13 | 23 | 10 | 68 | 74 | 9 | 16 | |
| 12/2-11/24 | 22 | 66 | 13 | 17 | 28 | 67 | 64 | 16 | 8 | |
| 10/1-10/24 | 23 | 62 | 15 | 12 | 37 | 68 | 57 | 19 | 7 | |
| 7/24-8/1/24 | 23 | 61 | 16 | 16 | 30 | 64 | 62 | 20 | 8 | |
| 5/6-15/24 | 16 | 63 | 21 | 10 | 20 | 60 | 70 | 30 | 10 | |
| 3/18-28/24 | 18 | 63 | 19 | 10 | 27 | 67 | 61 | 23 | 13 | |
| 2/5-15/24 | 17 | 63 | 20 | 11 | 28 | 64 | 66 | 25 | 7 | |
| 11/2-7/23 | 18 | 64 | 18 | 12 | 27 | 66 | 65 | 22 | 9 | |
| 9/18-25/23 | 18 | 64 | 17 | 13 | 23 | 61 | 67 | 26 | 10 | |
| 7/7-12/23 | 21 | 61 | 18 | 13 | 34 | 63 | 58 | 24 | 9 | |
| 5/8-18/23 | 17 | 62 | 21 | 11 | 24 | 60 | 68 | 29 | 9 | |
| 3/13-22/23 | 18 | 64 | 19 | 12 | 25 | 66 | 65 | 22 | 10 | |
| 1/9-20/23 | 22 | 61 | 16 | 13 | 34 | 62 | 60 | 25 | 6 | |
| 11/15-22/22 | 25 | 62 | 13 | 13 | 38 | 65 | 58 | 22 | 4 | |
| 9/7-14/22 | 22 | 63 | 15 | 10 | 35 | 70 | 58 | 21 | 6 | |
| 7/5-12/22 | 20 | 63 | 17 | 10 | 29 | 70 | 65 | 20 | 6 | |
| 5/9-19/22 | 23 | 56 | 21 | 12 | 34 | 62 | 57 | 26 | 9 | |
| 3/14-24/22 | 23 | 58 | 18 | 9 | 36 | 63 | 57 | 28 | 7 | |
| 1/10-21/22 | 18 | 63 | 18 | 9 | 29 | 63 | 65 | 28 | 6 | |
| 11/1-10/21 | 24 | 59 | 17 | 13 | 36 | 60 | 59 | 28 | 5 | |
| 9/7-16/21 | 27 | 57 | 16 | 12 | 42 | 65 | 52 | 23 | 5 | |
| Marquette Law School Poll, national surveys, latest: June 9-15, 2026 | ||||||||||
| Question: How much of the time do you think you can trust the government in Washington to do what is right? | ||||||||||
Confidence in institutions
As generalized trust in government has declined in recent decades, so has confidence in many institutions. Some institutions retain high public confidence, while confidence in others is quite low. To compare a variety of institutions, the Marquette Law School Poll asked about 18 institutions.
Doctors have the highest net confidence rating (percent with a great deal/quite a lot minus percent very little/none), followed by the U.S. military, the police, and local schools. Other positive net ratings go to colleges and universities and the people who administer state elections. The other 12 institutions have net negative confidence ratings. Only slightly negative are local news media, the U.S. Supreme Court, and the Food and Drug Administration, each less than 10 percentage points negative.
State legislatures are viewed negatively at -16 net, but far better than Congress at -43. Other federal institutions with net negative ratings are the U.S. Department of Justice (-21) and the executive branch (-30).
Business fares rather poorly: business leaders are at -24, companies developing artificial intelligence are at -47, and Facebook has the lowest rating of all at -66.
National news media gets a very negative -31 rating, much worse than local news media’s -2.
Confidence in voters is also quite low, with a -29 net confidence rating.
The full set of ratings is shown in Table 2.
Table 2: Confidence in institutions
Among adults, ordered by net confidence
| Institution | Confidence | |||
| Net confident minus not confident | Great deal/quite a lot | Some | Very little/none | |
| Your doctor | 64 | 70 | 24 | 6 |
| The U.S. military | 38 | 55 | 28 | 17 |
| The police | 24 | 45 | 33 | 21 |
| Your local schools | 21 | 40 | 41 | 19 |
| Colleges and universities | 12 | 37 | 38 | 25 |
| The people who administer elections in your state | 10 | 38 | 34 | 28 |
| Your local news media | -2 | 28 | 41 | 30 |
| The U.S. Supreme Court | -6 | 29 | 35 | 35 |
| The Food and Drug Administration (FDA) | -8 | 26 | 40 | 34 |
| Your state legislature | -16 | 20 | 44 | 36 |
| The U.S. Department of Justice | -21 | 20 | 39 | 41 |
| Business leaders | -24 | 15 | 47 | 39 |
| The American people in electing leaders | -29 | 13 | 45 | 42 |
| The executive branch of the federal government | -30 | 18 | 34 | 48 |
| The national news media | -31 | 16 | 36 | 47 |
| Congress | -43 | 10 | 37 | 53 |
| Companies developing artificial intelligence (AI) | -47 | 10 | 33 | 57 |
| -66 | 5 | 24 | 71 | |
| Marquette Law School Poll, national survey June 9-15, 2026 | ||||
| Question: Here is a list of institutions in American society. How much confidence do you have in each one? | ||||
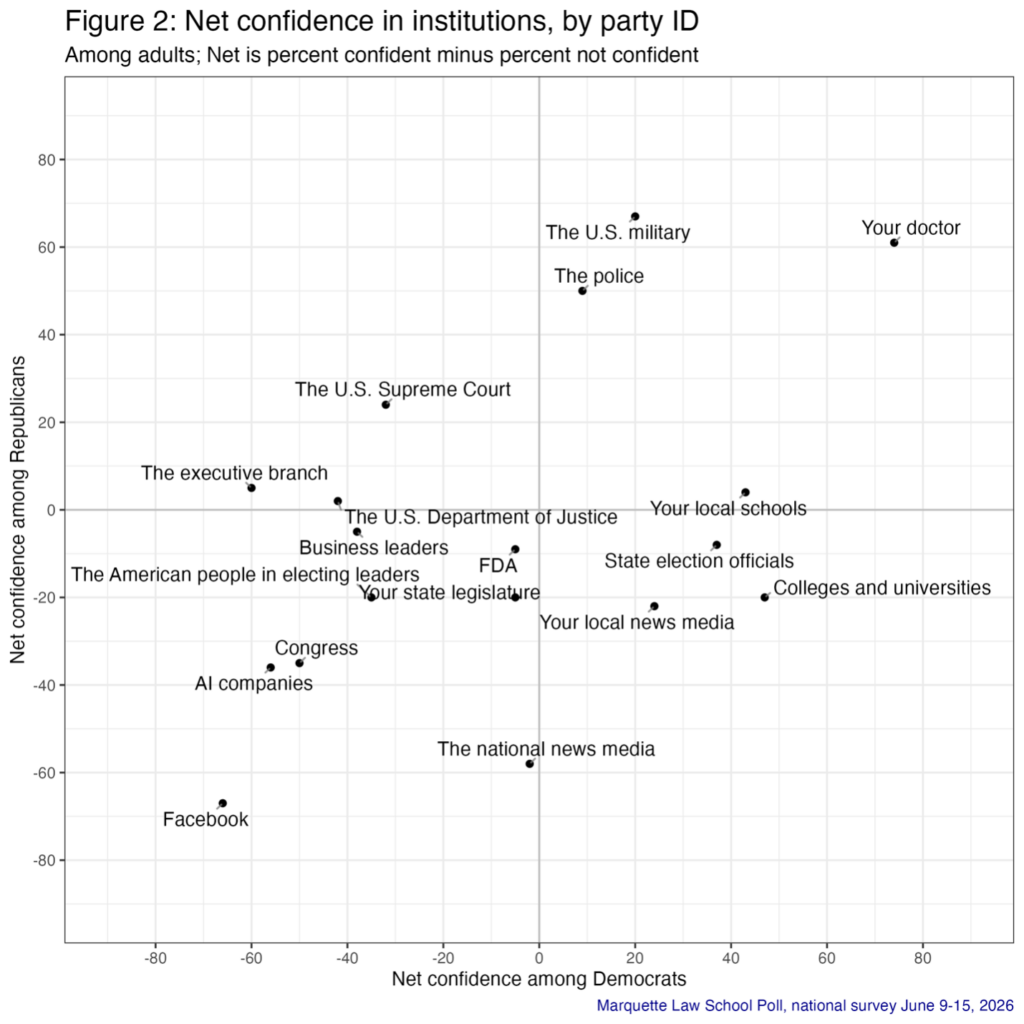
Partisans see some of these institutions quite differently, though there are some common perceptions as well. There are some institutions viewed positively by both Republicans and Democrats, such as doctors, the military, and the police. Likewise, there is agreement in negative assessments of Congress, AI companies, and Facebook. Partisans disagree in views of the Supreme Court and the executive branch (seen positively by Republicans but negatively by Democrats) and on state election officials, colleges and universities, and local news media (seen positively by Democrats but negatively by Republicans). Of the 18 institutions, eight are seen negatively by both parties and four are viewed positively by both. Net confidence by party is shown in Figure 2.
The numerical values for net confidence by party are shown in Table 3.
Table 3: Net confidence in institutions, by party ID
Among adults
| Institution | Confidence | |||
| All net confidence | Republican | Independent | Democrat | |
| Your doctor | 64 | 61 | 36 | 74 |
| The U.S. military | 38 | 67 | 8 | 20 |
| The police | 24 | 50 | -9 | 9 |
| Your local schools | 21 | 4 | 3 | 43 |
| Colleges and universities | 12 | -20 | -5 | 47 |
| The people who administer elections in your state | 10 | -8 | -24 | 37 |
| Your local news media | -2 | -22 | -21 | 24 |
| The U.S. Supreme Court | -6 | 24 | -20 | -32 |
| The Food and Drug Administration (FDA) | -8 | -9 | -18 | -5 |
| Your state legislature | -16 | -20 | -36 | -5 |
| The U.S. Department of Justice | -21 | 2 | -27 | -42 |
| Business leaders | -24 | -5 | -41 | -38 |
| The American people in electing leaders | -29 | -20 | -38 | -35 |
| The executive branch of the federal government | -30 | 5 | -40 | -60 |
| The national news media | -31 | -58 | -35 | -2 |
| Congress | -43 | -35 | -49 | -50 |
| Companies developing artificial intelligence (AI) | -47 | -36 | -54 | -56 |
| -66 | -67 | -61 | -66 | |
| Marquette Law School Poll, national survey June 9-15, 2026 | ||||
| Question: Here is a list of institutions in American society. How much confidence do you have in each one? | ||||
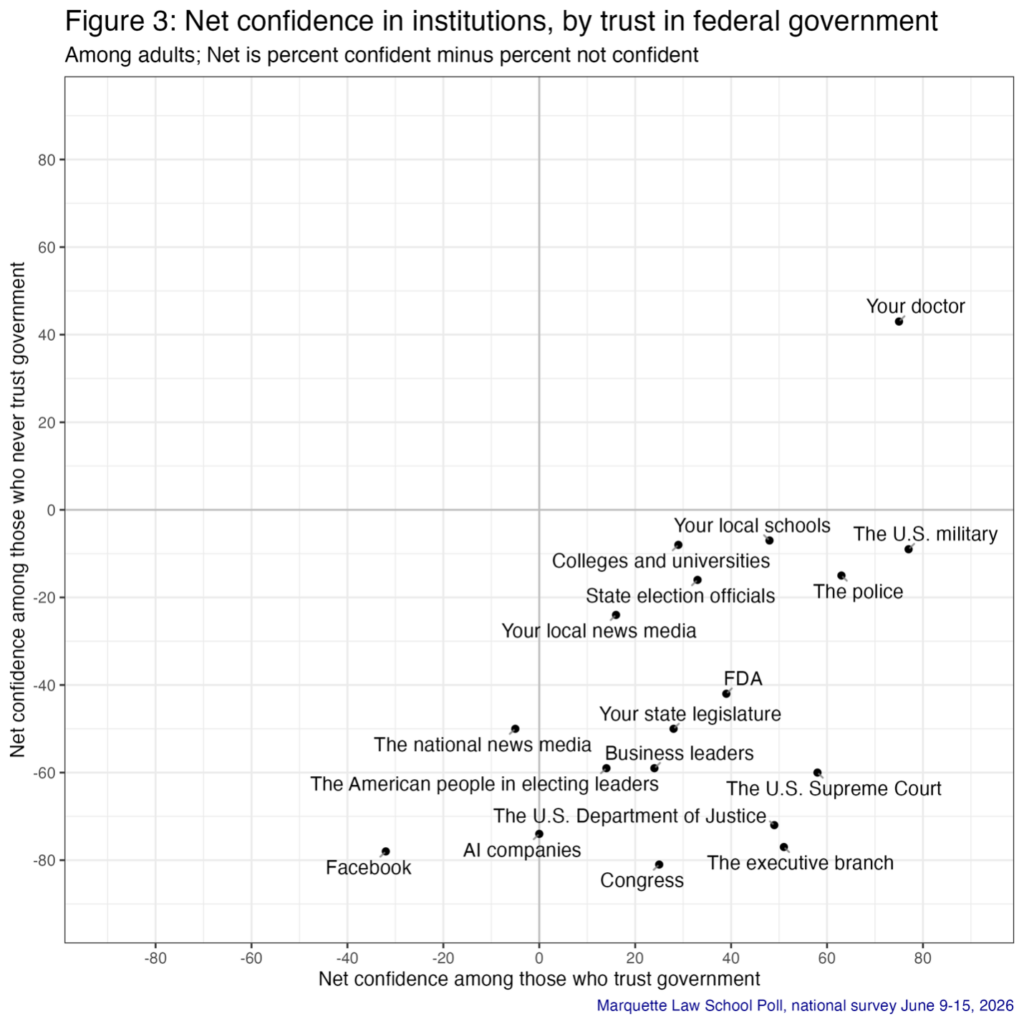
People who say they don’t trust the federal government also have much less confidence in virtually all institutions, whether governmental or not. Only one institution gets a positive net rating from those distrustful of the government: doctors. All of the 17 other institutions have net negative ratings within this group. Those who do not trust the federal government generally are especially distrustful of particular federal institutions, including the executive branch, Congress, the Supreme Court, the Department of Justice, and the FDA. They are less negative as a group to local schools, the military, colleges and universities, the police, state election officials, and local news media. Business leaders, AI companies, and Facebook also receive very negative ratings from those who distrust government.
In contrast, those who generally trust the federal government tend to be quite positive about almost all the 18 institutions, whether governmental or not. They give net negative ratings only to the national news media and Facebook, with AI companies at a net zero.
Institutional net confidence by trust in the federal government is shown in Figure 3.
The numerical net confidence ratings by trust in government are shown in Table 4.
Table 4: Net confidence in institutions, by trust in federal government
Among adults
| Institution | Trust in federal government | |||
| All net confidence | Always/most of the time | Only some of the time | Never | |
| Your doctor | 64 | 75 | 67 | 43 |
| The U.S. military | 38 | 77 | 42 | -9 |
| The police | 24 | 63 | 24 | -15 |
| Your local schools | 21 | 48 | 20 | -7 |
| Colleges and universities | 12 | 29 | 12 | -8 |
| The people who administer elections in your state | 10 | 33 | 10 | -16 |
| Your local news media | -2 | 16 | -1 | -24 |
| The U.S. Supreme Court | -6 | 58 | -9 | -60 |
| The Food and Drug Administration (FDA) | -8 | 39 | -12 | -42 |
| Your state legislature | -16 | 28 | -17 | -50 |
| The U.S. Department of Justice | -21 | 49 | -26 | -72 |
| Business leaders | -24 | 24 | -27 | -59 |
| The American people in electing leaders | -29 | 14 | -32 | -59 |
| The executive branch of the federal government | -30 | 51 | -39 | -77 |
| The national news media | -31 | -5 | -33 | -50 |
| Congress | -43 | 25 | -52 | -81 |
| Companies developing artificial intelligence (AI) | -47 | 0 | -52 | -74 |
| -66 | -32 | -71 | -78 | |
| Marquette Law School Poll, national survey June 9-15, 2026 | ||||
| Question: Here is a list of institutions in American society. How much confidence do you have in each one? | ||||
Congressional generic ballot and turnout
Among registered voters, 47% say they will vote for the Democratic candidate in the November congressional elections, while 45% will vote for the Republican. An additional 6% say they will vote for neither, and 2% won’t vote.
Among likely voters, i.e., those who say they are absolutely certain they will vote, 53% support the Democrat and 45% favor the Republican, while 2% say they will vote for neither.
There have been shifting margins in the congressional ballot since November 2025, and the margin depends also on whether one is looking at registered voters or at likely voters. The vote margin has been tighter among registered voters, with a larger Democratic advantage among likely voters. These results are shown for registered voters and for likely voters in Table 5.
Table 5: Congressional ballot for registered voters and for likely voters
Among registered and likely voters
| Sample population | Congressional vote | ||||
| Dem minus Rep margin | Democrat | Republican | Neither | Would not vote | |
| Registered voters | |||||
| 6/9-15/26 | 2 | 47 | 45 | 6 | 2 |
| 5/20-26/26 | 1 | 46 | 45 | 7 | 1 |
| 4/8-16/26 | 4 | 48 | 44 | 6 | 1 |
| 1/21-28/26 | 4 | 48 | 44 | 7 | 1 |
| 11/5-12/25 | 5 | 49 | 44 | 6 | 1 |
| Likely voters | |||||
| 6/9-15/26 | 8 | 53 | 45 | 2 | 0 |
| 5/20-26/26 | 1 | 49 | 48 | 4 | 0 |
| 4/8-16/26 | 10 | 53 | 43 | 4 | 0 |
| 1/21-28/26 | 7 | 52 | 45 | 3 | 0 |
| 11/5-12/25 | 9 | 53 | 44 | 3 | 0 |
| Marquette Law School Poll, national survey June 9-15, 2026 | |||||
| Question: If the election for Congress were held today, would you vote for the (Democratic) candidate in your district or the (Republican) candidate in your district? | |||||
Among registered voters. the margin in June is a two-point Democratic advantage. It was just a single-point advantage in May, down slightly from four points in January and April.
The results for likely voters have been 7 to 10 percentage points of Democrats over Republicans in each poll since last November, except May when there was a one-point Democratic edge.
While underlying partisan preferences may be changing, the greater advantage for Democrats among likely voters is driven by how certain respondents are that they will vote in November. This intention to vote is not a constant and can change, either up or down, from month to month. While the intention to vote is a reliable indicator of turnout, especially as an election gets closer, there is always room for mobilization or demobilization.
The trend in certainty of voting among registered voters by party identification is shown in Table 6.
Table 6: Likelihood of voting among registered voters, by party identification
Among registered voters
| Poll dates | Likelihood of voting | |||
| Absolutely certain to vote | Very likely to vote | Chances are 50-50 | Don’t think will vote | |
| Republican | ||||
| 6/9-15/26 | 68 | 16 | 12 | 4 |
| 5/20-26/26 | 70 | 18 | 10 | 1 |
| 4/8-16/26 | 65 | 20 | 11 | 4 |
| 1/21-28/26 | 70 | 18 | 11 | 1 |
| 11/5-12/25 | 68 | 19 | 9 | 4 |
| Independent | ||||
| 6/9-15/26 | 38 | 25 | 21 | 14 |
| 5/20-26/26 | 38 | 28 | 26 | 8 |
| 4/8-16/26 | 33 | 25 | 32 | 9 |
| 1/21-28/26 | 41 | 26 | 26 | 7 |
| 11/5-12/25 | 37 | 27 | 22 | 14 |
| Democrat | ||||
| 6/9-15/26 | 76 | 14 | 8 | 3 |
| 5/20-26/26 | 72 | 20 | 8 | 0 |
| 4/8-16/26 | 77 | 14 | 8 | 1 |
| 1/21-28/26 | 72 | 17 | 7 | 4 |
| 11/5-12/25 | 75 | 16 | 7 | 2 |
| Marquette Law School Poll, national survey June 9-15, 2026 | ||||
| Question: What are the chances that you will vote in the November 2026 general election for congressional and state offices– are you absolutely certain to vote, very likely to vote, are the chances 50-50, or don’t you think you will vote? | ||||
Democrats have been significantly more likely to say they are certain to vote in each poll since last November, except May when there was only a 2 point advantage. The shrinkage of the Democratic turnout advantage that month accounts for the much tighter congressional vote margin then. With the return of a Democratic turnout advantage in the June poll, the Democratic margin among likely voters returned to eight percentage points. Across these five polls, Republicans who are certain to vote have varied from 65% to 70%, while Democrats have varied from 72% to 77%. Neither has shown a consistent upward or downward trend over time.
Independents are consistently less likely to vote than either partisan camp. While independents are an important potential swing vote in November in competitive races, their lower turnout means independents punch below their weight in elections, exerting less influence than they might with turnout closer to either set of partisans.
Party loyalty in this survey remains strong within both parties, if slightly higher among Democrats than Republicans. Among registered voters, independents are almost evenly divided, though a majority of independents say they will vote for neither the Republican nor the Democrat, with another 10 percent saying they will not vote. Among likely voters, independents favor the Democrat by 14 points, though a third say they will vote for neither party. This uncertainty in turnout and choice among independents is one of the factors that can shift as the election approaches and potential voters are mobilized. Congressional vote in June, among registered and likely voters, is shown by party identification in Table 7.
Table 7: Congressional ballot for registered and for likely voters, by party identification
Among registered and likely voters
| Party ID | Congressional vote | ||||
| Dem minus Rep margin | Democrat | Republican | Neither | Would not vote | |
| Registered voters | |||||
| Republican | -88 | 4 | 92 | 3 | 1 |
| Independent | 2 | 21 | 19 | 51 | 10 |
| Democrat | 95 | 96 | 1 | 2 | 1 |
| Likely voters | |||||
| Republican | -91 | 4 | 95 | 1 | NA |
| Independent | 14 | 40 | 26 | 34 | NA |
| Democrat | 99 | 99 | 0 | 1 | NA |
| Marquette Law School Poll, national survey June 9-15, 2026 | |||||
| Question: If the election for Congress were held today, would you vote for the (Democratic) candidate in your district or the (Republican) candidate in your district? | |||||
At 45% in this poll, the Republican congressional vote continues to be higher than the job approval rating for President Donald Trump, which stands at 38%, with 62% disapproving.
To get some measure of how Trump approval affects congressional vote within party, the Marquette polls from November through June have been pooled below in order to boost the number of cases in the rare categories of independents and Democrats who approve of Trump.
Among the 18% of Republicans in the pooled sample of registered voters who disapprove of Trump, 70% say they will vote for the Republican congressional candidate, with 20% crossing over to the Democrat and 10% voting for neither or not voting. Among Republicans approving of Trump, 97% support the Republican for Congress.
Among independents in the pooled sample, 18% approve of Trump. Among these respondents, 39% support the Republican candidate and 22% favor the Democratic candidate for Congress. In contrast, among the 81% of independents who disapprove of Trump, 32% favor the Democrat and 11% the Republican. Many independents say they favor neither or won’t vote regardless of approval of Trump.
There are only 5% of Democrats in the pooled sample who approve of Trump, and 24% of them say they will vote Republican in November, while 72% remain loyal to the Democratic candidate. Of the 95% of Democrats who disapprove of Trump, 97% back the Democrat for Congress and just 1% choose the Republican.
In sum, approval or disapproval of Trump influences congressional vote, but the effect is limited by the extent of partisan loyalty. Further, the high disapproval rates among independents and Democrats limit the practical effect of this crossover vote.
The congressional vote by Trump approval and party identification is shown in Table 8.
Table 8: Congressional ballot for registered voters, by Trump approval and party identification
Among registered voters, pooling Nov.-June polls
| Trump Approval | Congressional vote | ||||
| Dem minus Rep margin | Democrat | Republican | Neither | Would not vote | |
| Republican | |||||
| Approve | -96 | 1 | 97 | 2 | 1 |
| Disapprove | -50 | 20 | 70 | 9 | 1 |
| Independent | |||||
| Approve | -17 | 22 | 39 | 35 | 4 |
| Disapprove | 21 | 32 | 11 | 48 | 8 |
| Democrat | |||||
| Approve | 48 | 72 | 24 | 3 | 2 |
| Disapprove | 96 | 97 | 1 | 2 | 1 |
| Marquette Law School Poll, national surveys, Nov. 2025-June 2026 | |||||
| Question: If the election for Congress were held today, would you vote for the (Democratic) candidate in your district or the (Republican) candidate in your district? | |||||
About the Marquette Law School Poll
The survey was conducted June 9-15, 2026, interviewing 1,514 adults nationwide, with a margin of error of +/-2.7 percentage points. For registered voters, the sample size is 1,213, with a margin of error of +/-3.0 percentage points. For likely voters, the sample size is 827, with a margin of error of +/-3.6 percentage points.
Interviews were conducted using the SSRS Opinion Panel, a national probability sample with interviews conducted online. Certain other data from this survey are held for future release, or were previously released on June 24. The detailed methodology statement, survey instrument, topline results, and crosstabs for this release are available on the Marquette Law Poll website.