
Now Reading: The data driving Democratic optimism
- 01
The data driving Democratic optimism

The data driving Democratic optimism
No. 414 | September 4, 2026
A couple of weeks ago, I laid out the case for why the polls may be overstating Democrats again. That point coexists with the fact that this should be a pretty bad election cycle for Republicans. The main question is how much the GOP’s structural advantages — redistricting, races on red terrain — insulate them from the full effects of a bad midterm.
It’s not hyperbole to say the political environment is worse for them than in 2018, even though the seat losses — at least in the House — should be nowhere near as bad.
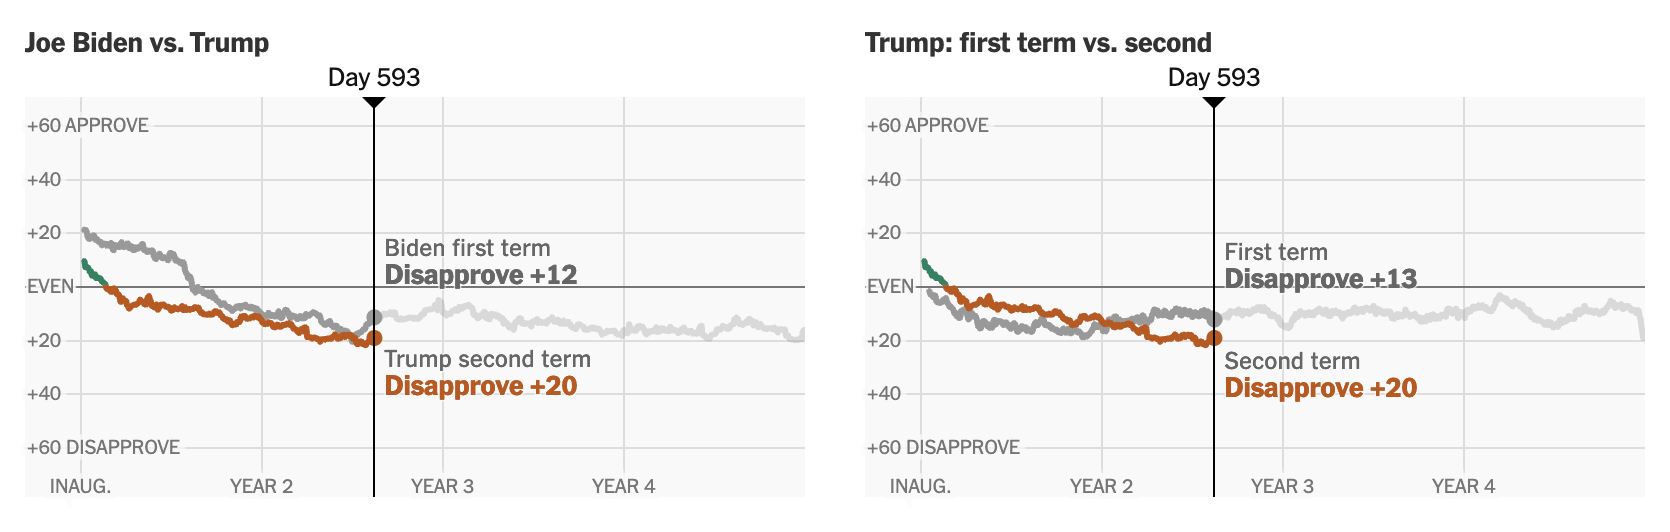
First, let’s take Donald Trump’s net approval rating. At -20, it’s 8 points worse than Joe Biden’s at this point four years ago, and 7 points worse than Trump heading into the 2018 midterms.
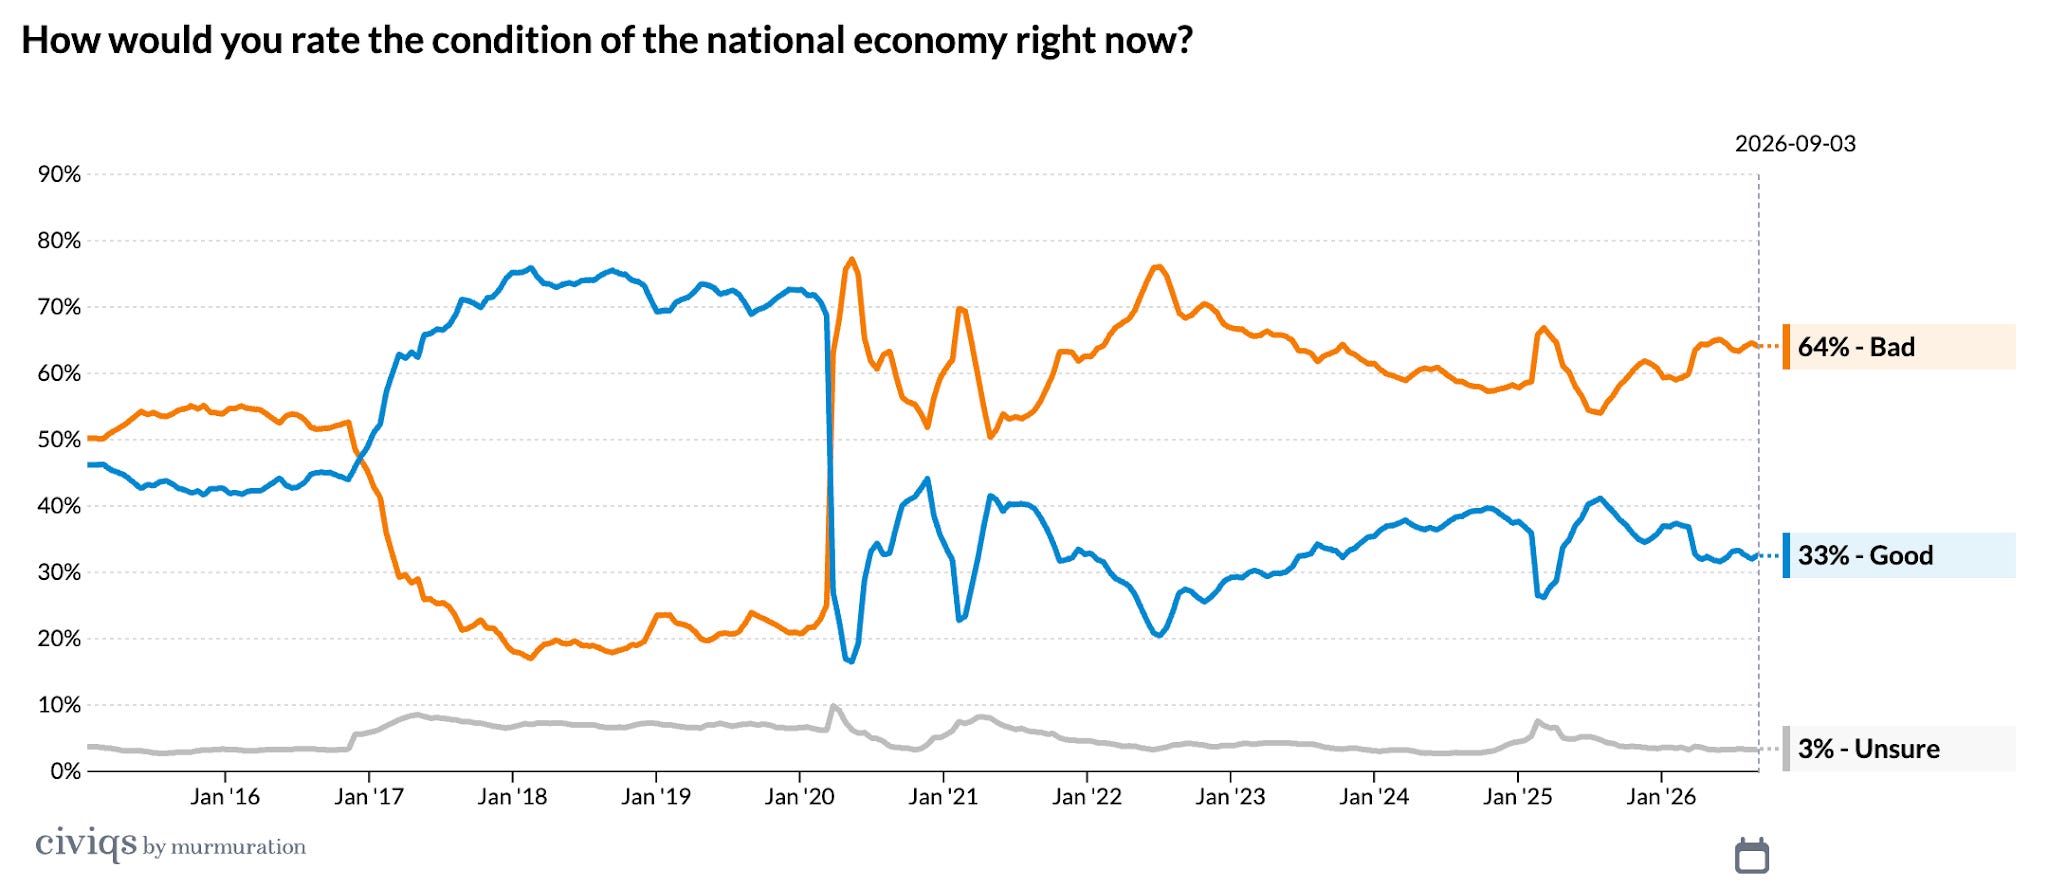
Then there’s the economy. In Civiqs’ tracking, 75% of registered voters rated the national economy as good and just 18% as bad at this point in 2018. Today, that’s flipped: 33% good and 64% bad. There’s a night and day difference in voter perceptions of the economy now versus 2018.
Another question is: how easily can you blame the person in charge for the number one problem facing the country? In the voters’ minds, who’s holding the murder weapon?
Trump in 2020 did not hold the murder weapon for mass unemployment. Despite an uneven response to the pandemic, he didn’t cause it and continued to hold strong ratings on the economy. Biden did hold the murder weapon on inflation and immigration, pursuing multiple rounds of inflationary spending and relaxing Trump-era border restrictions. Trump arguably didn’t when it came to the cost of living—until the Iran war spiked a new round of concern about inflation. Iran is not in and of itself something voters think about a lot, except as a cause of the problem that they’re most worried about getting worse.
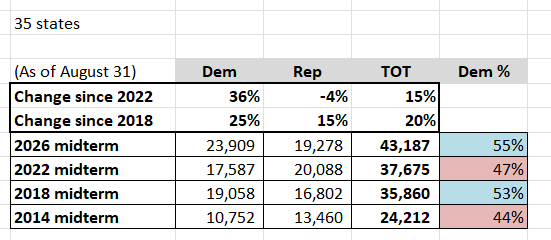
The primaries are another data point. According to data compiled by the great John Couvillon, Democrats are pacing ahead of 2018 primary turnout, usually a strong indicator for where November should land.
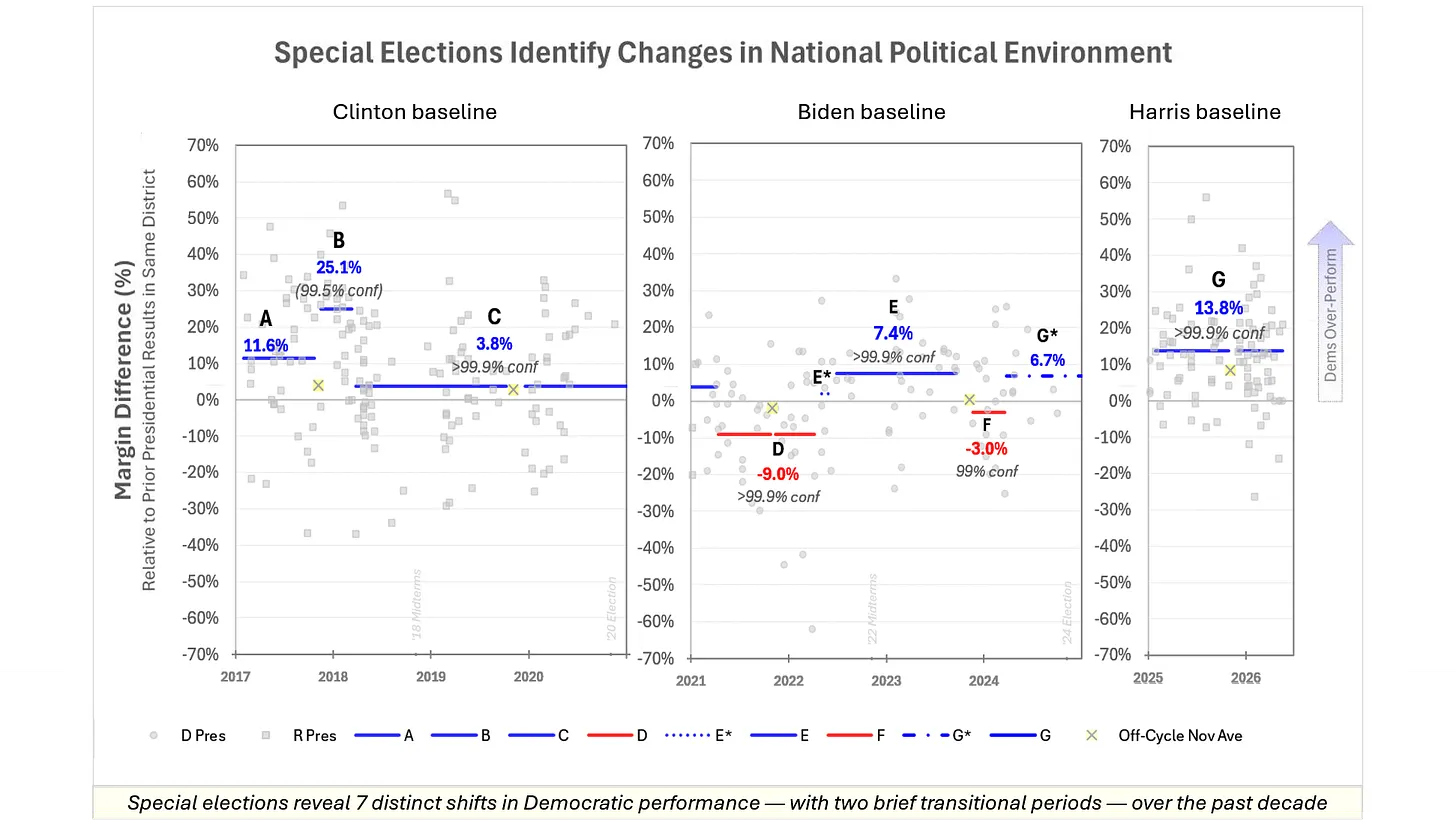
There are varying sources for special-election performance. Some show Republicans doing worse than in the 2018 cycle. This series looks on par or better for Republicans when compared with the late-2017/early-2018 peak, but still quite negative and consistent with a high single-digit Democratic generic ballot advantage.
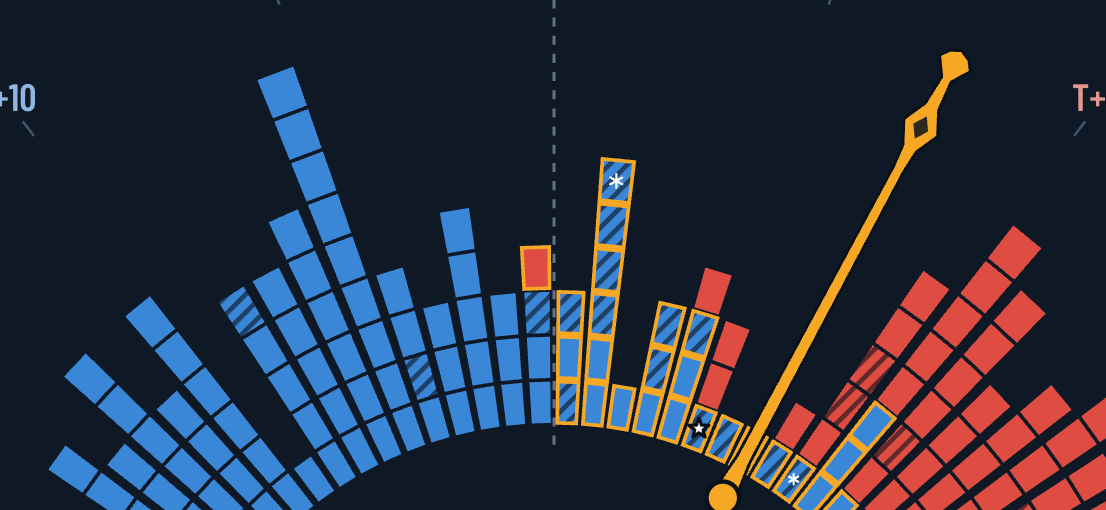
This election is about what happens when unstoppable force of bad national fundamentals meet the immovable object of a political geography that favors Republicans.
Does rising negative partisanship — even higher than 2018 — actually insulate Republicans? Biden had roughly the same net approval in 2022 as Trump did in 2018 but had a far better midterm. That was because Democrats were able to drive a negative message about election denialism and the danger of MAGA Republicans. Will Republicans be able to do the same, to make the election (at least a little) a referendum on the DSA?
The generic ballot right now, about D+6, is slightly better for Republicans than in 2018, something at odds with the fact that Trump’s approval is worse. Perhaps the fact that rising disapproval is coming from low-turnout independents and not Republicans (as in 2018) will also insulate them from the worst effects.
Perhaps. But perhaps one doth protest too much and we should just pay attention to the headline numbers. We’ll see in 60 days.
Starting next week, The Intersection will be releasing a series of new features and tools to help you better understand the midterms. I’m excited to share more!
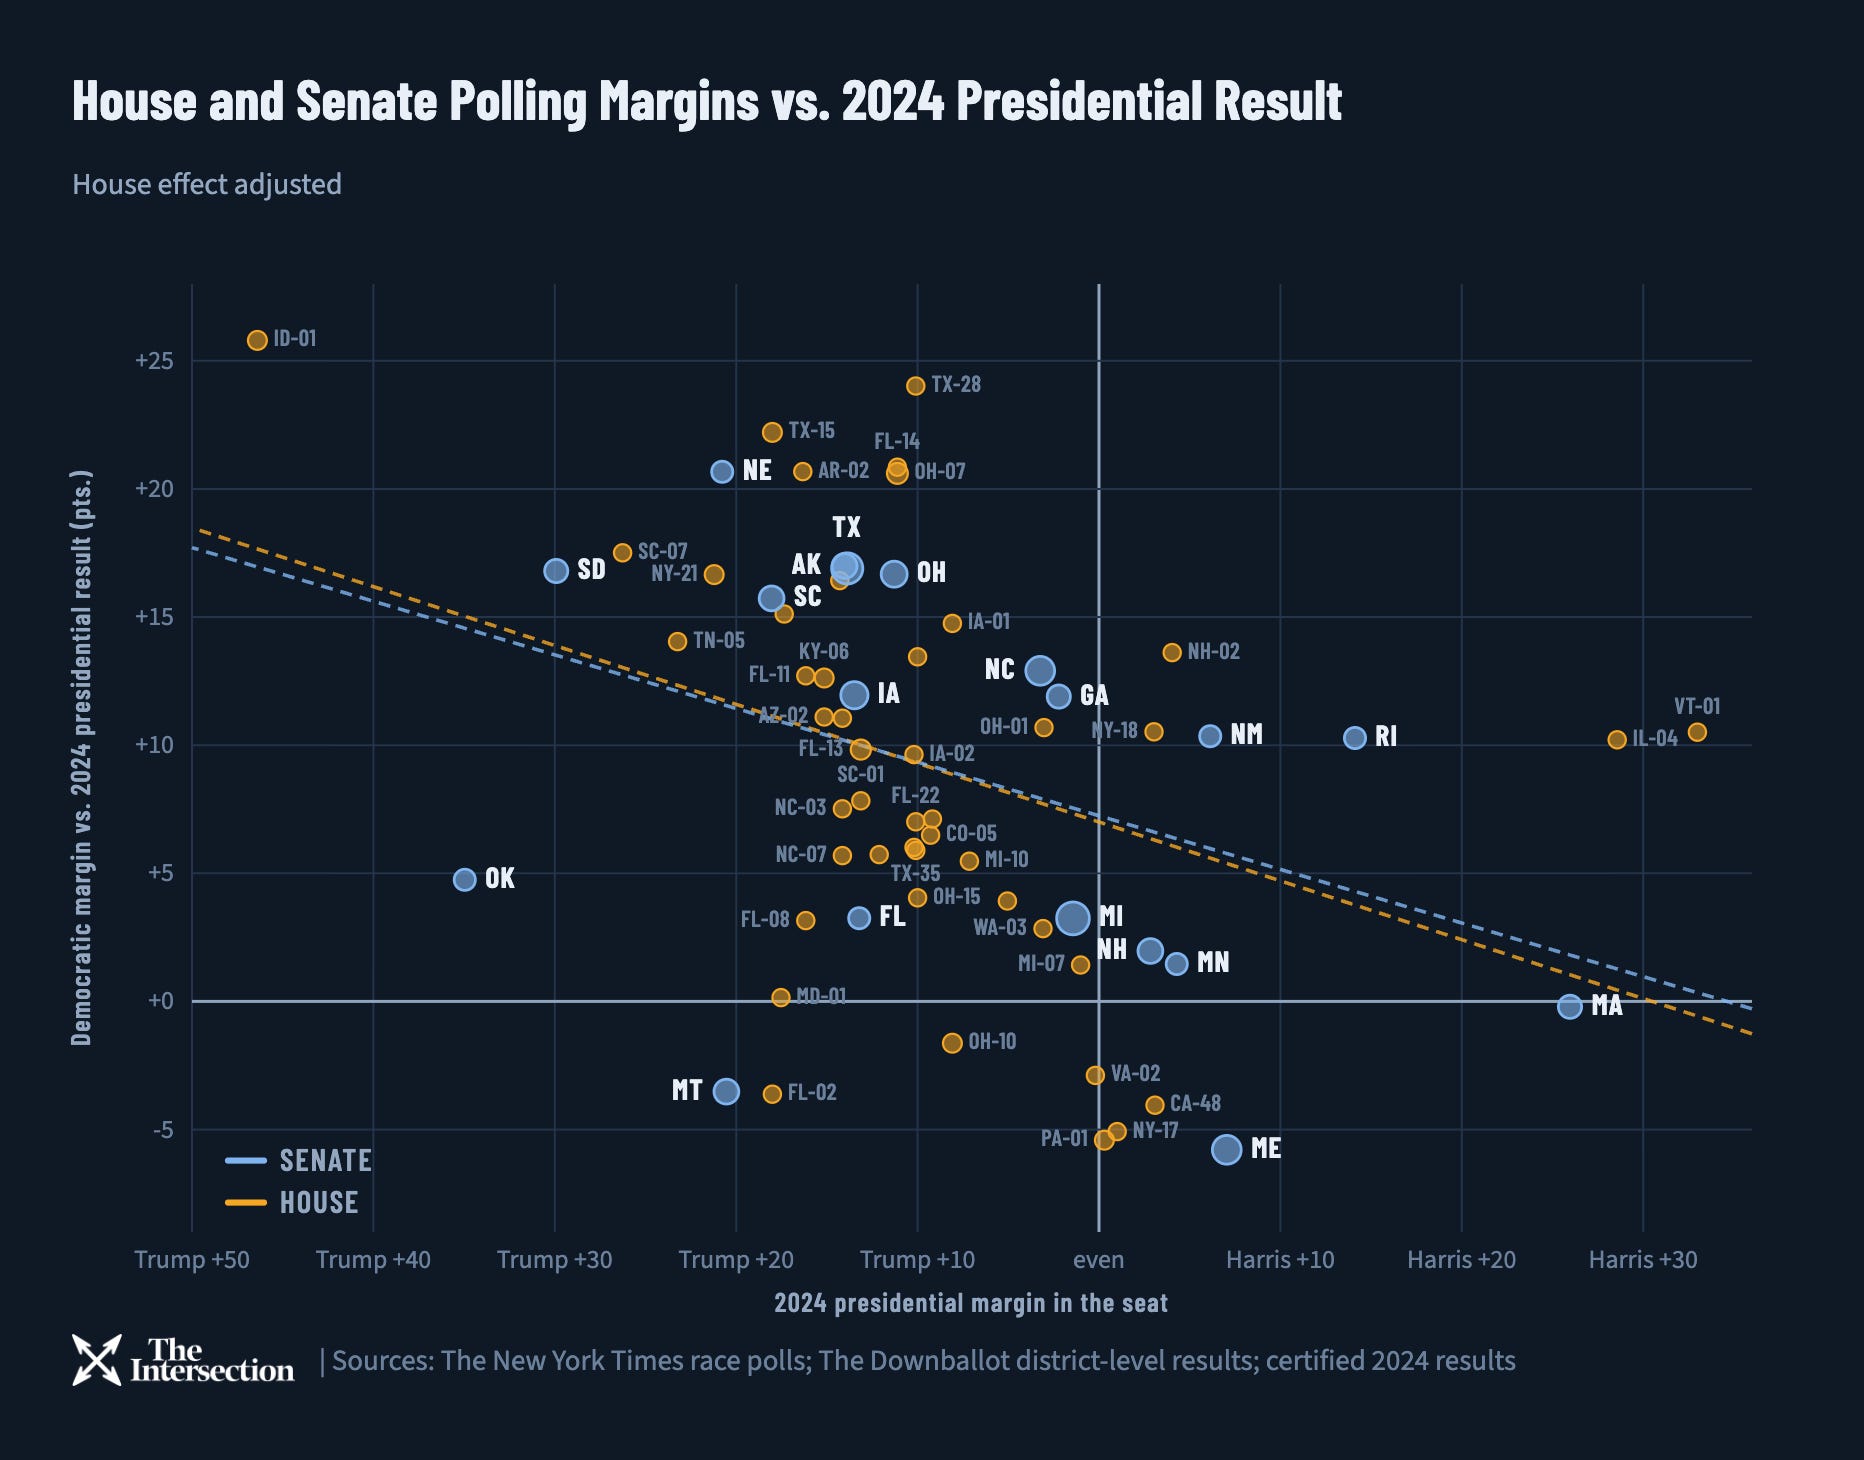
One thing I’ll get a little bit more specific about is a way to benchmark all the individual polls in House & Senate races to 2024 vote as another way to track the shift in the national political environment. Are shifts in the national generic ballot tricking down to individual races, or not?
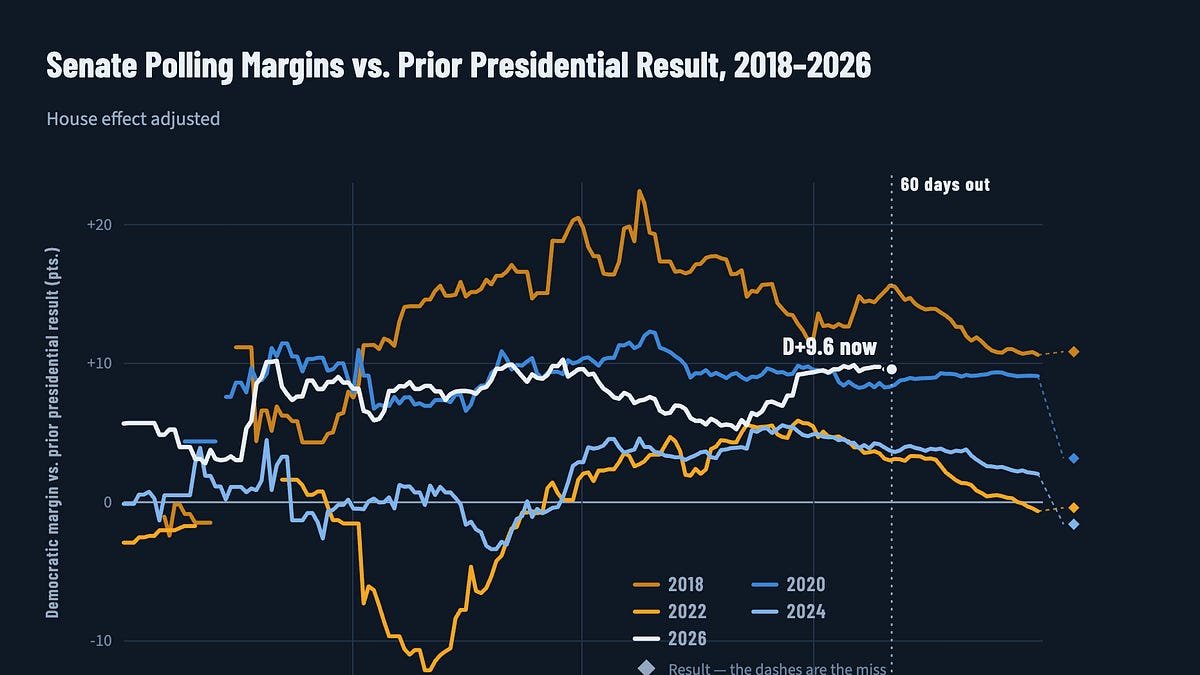
As previewed this morning on X, this will include a tracker of 2026 Senate polls versus where these same kinds of polls stood from 2018 to 2024. This builds on my work documenting the polling bias Democrats typically experience in the summer. And while Democrats are currently on something of a high, this hasn’t started coming down yet. In 2022, things had already started moving back towards Republicans, while this started right around now in 2018. If this line doesn’t budge, that’s bullish for Democrats.
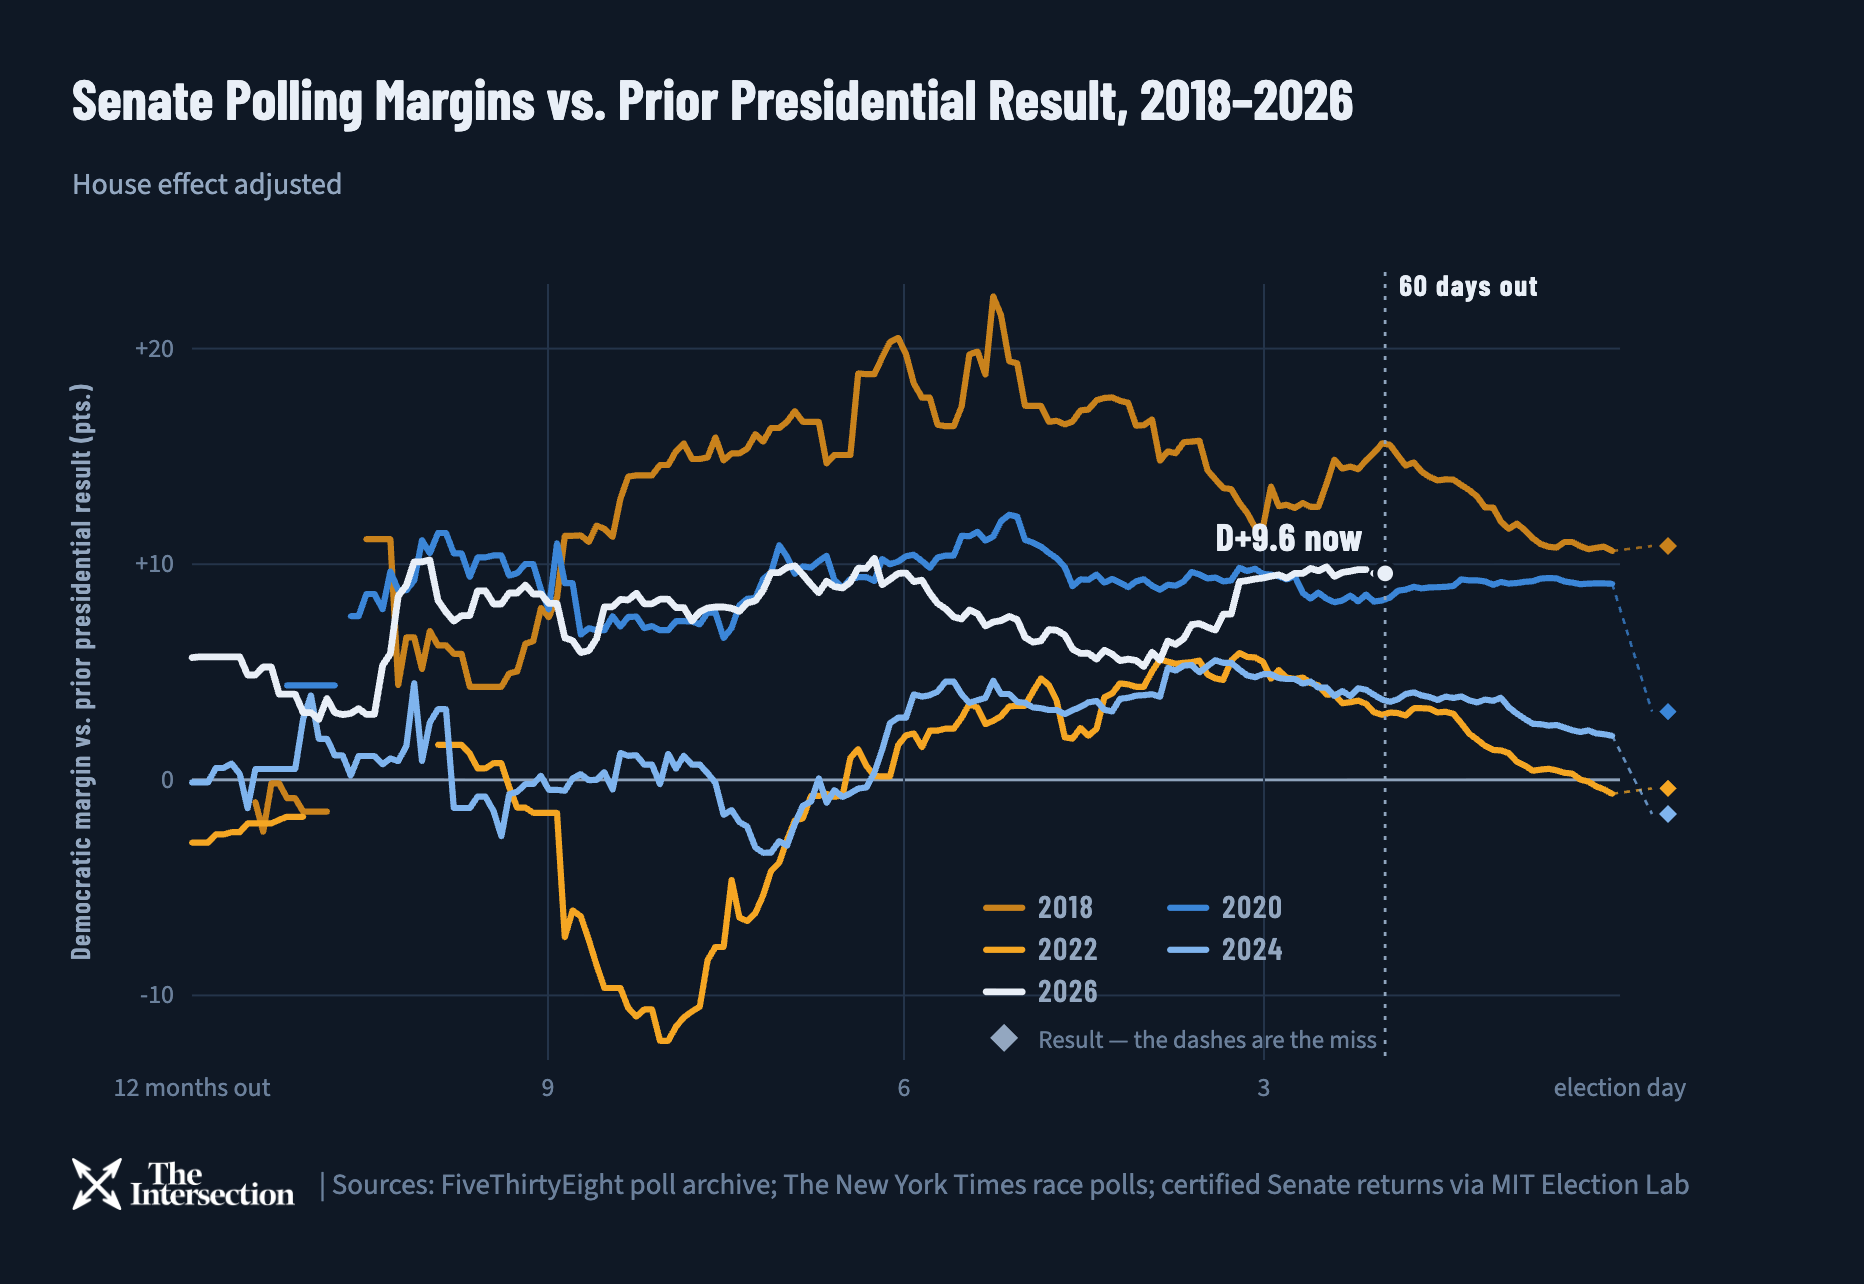
One warning sign is that a key signature of polling error is repeating itself: more Democratic polling overperformance in red states and districts, consistent with previous midterm cycles. And that’s with pollster house effects factored out.
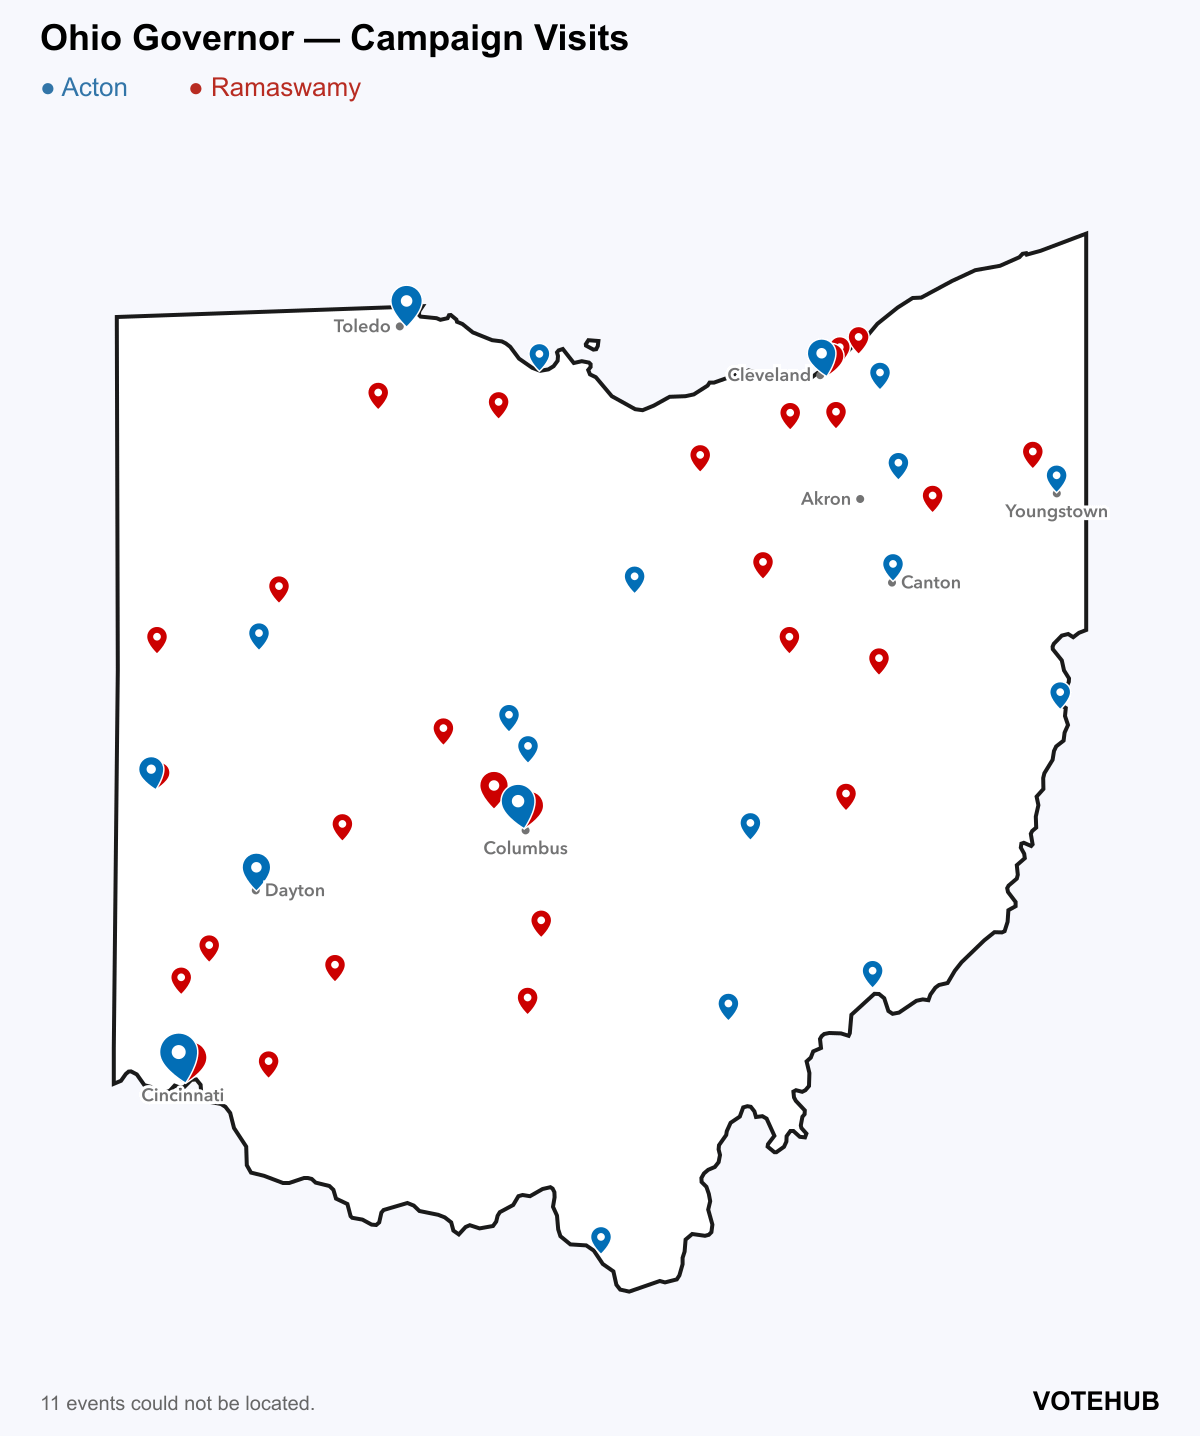
VoteHub keeps finding new ways to feed our collective election-data habit. Its new Campaign Tracker maps where Senate and gubernatorial candidates have been and where they’re headed next.
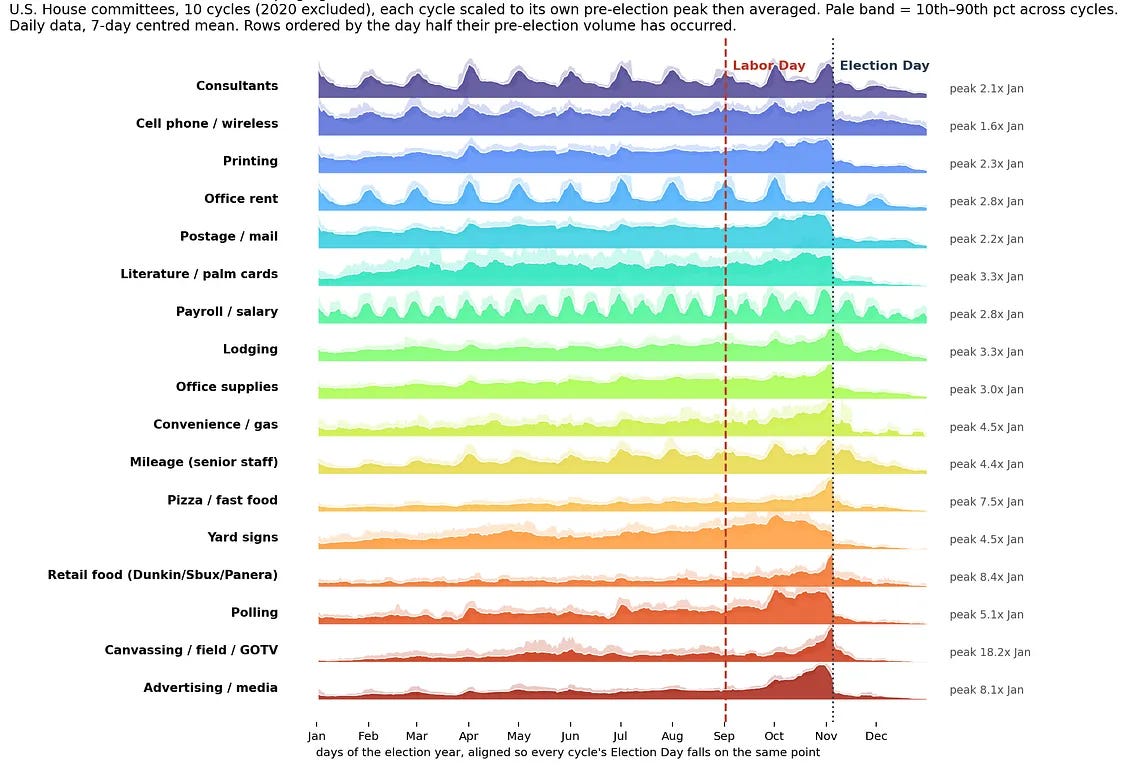
Jordan Lieberman does yeoman’s work to break down campaign spending from every imaginable direction. And here’s a chart anyone in the game will appreciate, answering when campaigns actually spend money on various functions. The most backloaded expenses are GOTV, media, and… food.
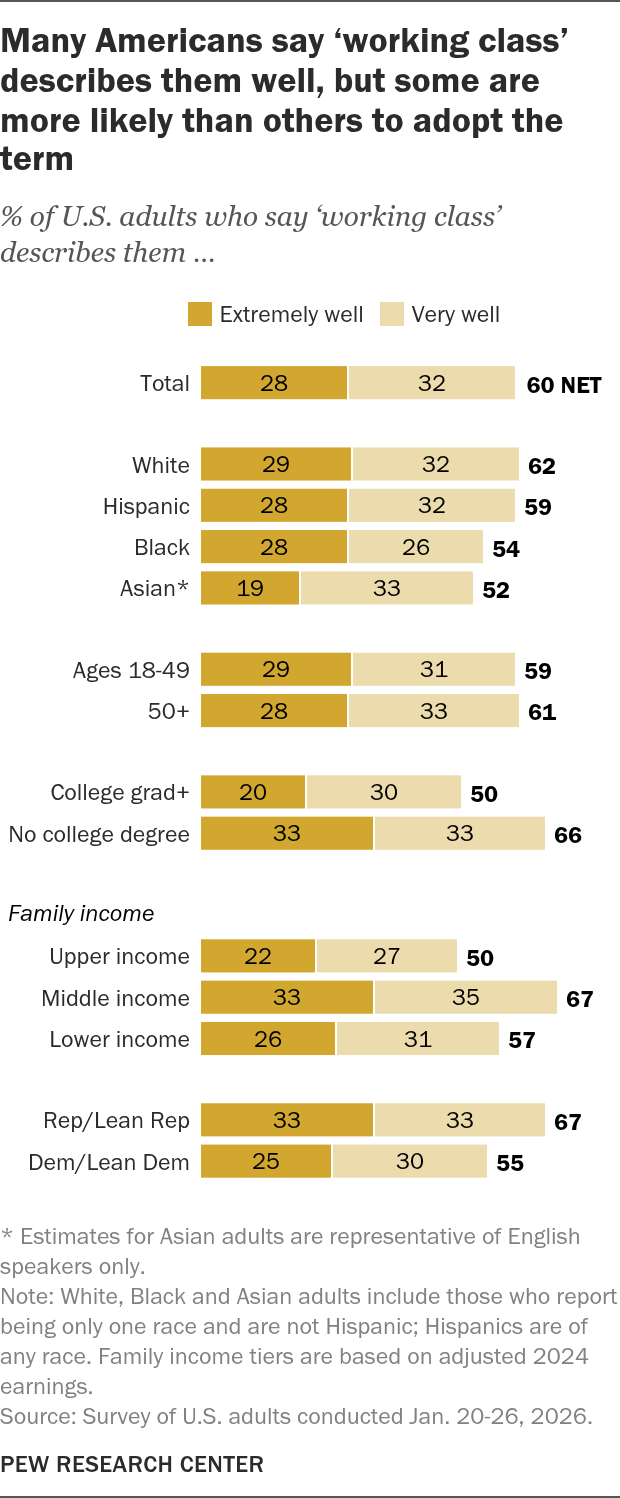
Half of college graduates and half of upper-income Americans call themselves working class, according to Pew. So do 60% of Americans overall. It’s clearly not just people without college degrees or with low incomes.
And Republicans are more likely to claim the label: 67% versus 55% of Democrats. That gap persists among people with money and degrees. Among upper-income adults, it’s 61% of Republicans versus 38% of Democrats. Among college graduates, it’s 56% versus 44%. When we talk about Republicans now being a party of the working class, that’s not just about electoral shifts in working class precincts, but about the self-identity that Republicans ascribe to themselves.
Burning Man has a census that puts people in their 20s at just 10% of attendees in 2025, down from about 30% in 2014. People in their 30s still make up the biggest group, but those in their 40s and 50s are gaining ground. Burning Man is now a haven for elder millennials with Gen Z checking out. David Shor comments:

David Shor@davidshor
They deserve a ton of credit for incredible record keeping though: blackrockcitycensus.org/intro
5:40 AM · Sep 1, 2026 · 330K Views
47 Replies · 42 Reposts · 834 Likes
And here’s the New York Post’s spin on the same data:

New York Post@nypost

9:00 PM · Sep 3, 2026 · 1.67M Views
483 Replies · 359 Reposts · 5.6K Likes