
Now Reading: New NFL blocking, pass rush win rate formulas and takeaways
- 01
New NFL blocking, pass rush win rate formulas and takeaways

New NFL blocking, pass rush win rate formulas and takeaways
Brian Burke
Close
Brian Burke
ESPN Analytics
- Senior Analytics Specialist at ESPN
- Former consultant to NFL teams
- Pioneer of football analytics
Seth Walder
CloseSeth Walder
ESPN Analytics
- Seth Walder is an analytics writer at ESPN, specializing in quantitative analysis. He is also a regular on “ESPN Bet Live” and helps cover sports betting. Seth has been at ESPN since 2017. He previously worked at the New York Daily News covering the Jets and Giants. You can follow Seth on X via @SethWalder.


Multiple Authors
Eight years after ESPN first launched its pass block and pass rush win rate statistics, they are both getting an upgrade.
Win rates held up well considering they were the first NFL player-tracking metrics that ESPN created. But we’ve learned a lot — and watched a ton of Micah Parsons pass-rush wins — in the interim and have now implemented a bit of a facelift entering the 2026 NFL season. The result? Significant improvement in stability and reliability.
ESPN sports data scientist Brian Burke explained the changes that we’ve made below, and analytics writer Seth Walder outlined five storylines that have surfaced with the tweaks.
Jump to:
Changes | Storylines

Burke: What’s different?
The metrics generally work the same as they always have. They treat the pass rush and protection with a weak-link survival systems approach. The survival aspect means time is an essential factor — winning a block at 2.0 seconds is very different than at 4.0 seconds. The “weak-link” aspect applies to the team/unit level, meaning any single pass-block loss on a play triggers a loss for the entire unit. After all, it really doesn’t matter if there are four solid blocks and one failed block — it only takes a single successful pass rusher to dramatically affect a play.
A rusher generally triggers a win when his tracking chips are closer to the QB than those of his blocker(s). Win rates track the blocks throughout the duration of the play, creating a survival curve for any player or unit. For simplicity, we made 2.5 seconds after the snap the baseline for win rates, a reasonably representative single number that’s easier to communicate than full curves at each time step. Think of win rates as a batting average for linemen.
The most notable addition this season is the inclusion of a “bull rush win,” when a defender pushes his blocker close enough to the QB to affect his vision or ability to step up, or forces him out of the pocket. The pass rusher might not get his tracking chips past his blocker’s chips, but he successfully disrupted the play. We are confident that our definition of a bull rush win is useful. Just like for the legacy “chips past your blockers by 2.5 seconds” rule, plays with a bull win have a dramatically lower completion percentage, yards per attempt and EPA per play.
In addition to bull rushes, we’ve made other improvements, such as fixing false positives from outside speed rushes when the rusher is never really a threat to the pocket, therefore refining the way blocks are defined and identified. These improvements have resulted in solid increases in year-over-year reliability. To the degree any metric measures personal skill, you would expect it to correlate with any single player from one year to the next. Reliability correlations increased from 0.53 for the legacy metrics to 0.59 for the new formulation. These are solid numbers as far as sports metrics go — for context, MLB batting averages have between 0.4 to 0.5 year-to-year reliability.
The legacy win rates correlated with EPA per play at 0.24, meaning that the metrics could account for about a quarter of the outcome of any play. The new version correlates at 0.34, accounting for about a third of the play outcome. This is a substantial amount, given everything else that affects a pass play — including the QB, receivers and pass coverage, not to mention old-fashioned sample error.
Win rate correlation with EPA also compares favorably to competing benchmark metrics. It’s important to note that win rates do not see the outcome of the play by design. They can’t cheat and know whether there was a sack or if the QB escaped pressure to throw a heroic touchdown. They’re intended to isolate individual line play from everything else that’s happening.
The new formulation also addresses some past criticisms of win rates. They now identify chip blocks, both in terms of which pass rushers get chipped the most and which tackles get the most chip help. They also classify defensive stunts such as twists and simulated pressure. While we don’t adjust the core win rate metrics for these factors, we will report them alongside the metrics the same way we’ve done with double-teams.
Walder: Five win rate storylines to watch

1. Nick Herbig is still good in PRWR … but no longer elite
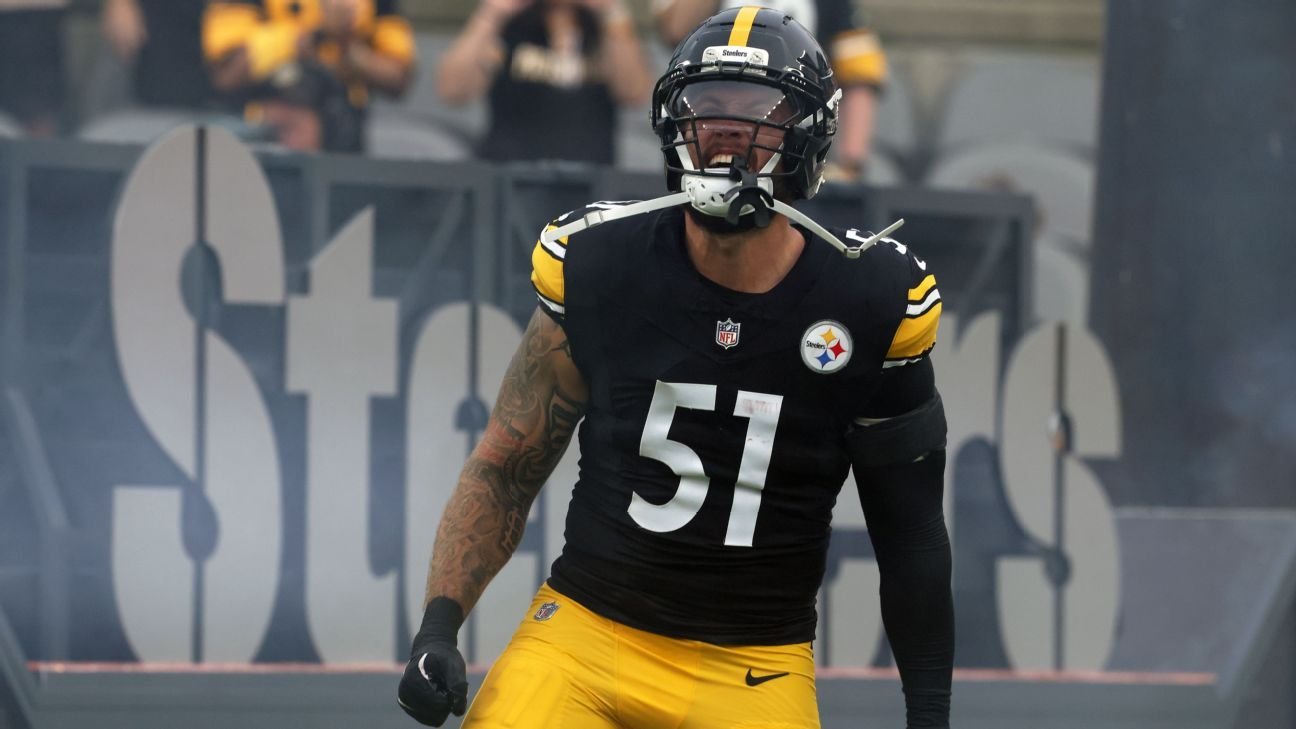
Herbig has fascinated me for years because of his pass rush win rate prowess (26.3% in 2025, No. 1 in the NFL) combined with the Steelers’ apparent hesitation to play him more. Part of the disconnect is that Herbig perhaps benefited disproportionately from the weak points of the old pass rush win rates metric — high outside speed rushes when a defender gets too vertical to the point where he’s not a threat to the quarterback even if he passes his blocker.
The removal of these wins dropped Herbig’s pass rush win rate at edge more than any other player. In the updated metric, Herbig’s pass rush win rate at edge is 14.3% — 14th best at the position. That’s above average and well worth the big contract the Steelers gave him this offseason. But it is not elite territory; he’s no longer competing with Packers edge rusher Micah Parsons at the top of the board. Broncos edge Nik Bonitto, meanwhile, dropped from third (23.5%) to 10th (15.4%) at the position in the new version.
What about in the other direction? Some big gainers included free agent Joey Bosa, the Lions’ Aidan Hutchinson and the Commanders’ Odafe Oweh — who each ranked in the top five in pass rush win rate at edge last season. The most surprising is Bosa, a 31-year-old former star. What changed for him? More than anything else, the metric’s improved requirements about proximity to the quarterback shifted several of his previously designated losses into wins. Check out the top 10 at both edge and defensive tackle:

2. Who won the most with bull rushes?
Bull rush wins were undercounted before, which has been corrected in the updated version. So, we can now see the value of power rushing more clearly.
Bull rush wins are much more rare than traditional get-past-your-blocker pass-rush wins, and they’re actually more valuable. The chance of a sack on a play featuring a bull rush win increases by eight percentage points (compared to six for all pass-rush wins). Even when the defense doesn’t get home, the effect is large. Offenses average 6.3 yards per pass attempt on plays without a bull rush win to 5.0 with one.
So, which players stand out for their bull-rushing ability? No one had more bull rush wins than Seahawks defensive tackle Leonard Williams‘ 18 last season, followed by Titans defensive tackle Jeffery Simmons‘ 16. Both players’ overall pass rush win rate at defensive tackle increased with the change in the formula.
Lions defensive tackle Alim McNeill recorded the highest bull rush win rate — as in, bull rush wins per pass rush — among players with at least 200 pass rushes.
3. Who was chipped the most?
No player was chipped more often last season than Steelers edge rusher T.J. Watt, who was chipped on 24.2% of his pass rushes — well ahead of the Rams’ Myles Garrett, who finished second at 21.9%. They were followed by Browns edge Alex Wright (21.4%), Texans edge Will Anderson Jr. (20.9%) and Cowboys edge Rashan Gary (20.2%).
But does that explain Watt’s down 2025, when his 10.1% pass rush win rate at edge ranked only 33rd? Not quite. Because when we look at percentage of plays when edge rushers were chipped or double-teamed, Watt no longer stands out, finishing 12th among edges (36.6%). Parsons easily commanded the most attention when combining the two, getting chipped or doubled on 54.0% of pass rushes, with Garrett finishing second at 46.1%. Parsons and Garrett ended up finishing first and fifth, respectively, in pass rush win rate at edge, well ahead of Watt.

4. Which offensive linemen get the most chip help? And which blockers moved the most in the rankings?
The chip rankings are pretty telling in terms of what NFL teams think of their tackles. The players who received the least amount of chip blocking help last season were Taylor Moton (Panthers), Dion Dawkins (Bills), Jordan Mailata (Eagles), Tristan Wirfs (Buccaneers) and Jermaine Eluemunor (Giants). The first four are high-caliber tackles, and Eluemunor landed a decent payday to remain with New York this offseason.
The bottom of the rankings tells a different story. Justin Skule (Buccaneers), Charlie Heck (Dolphins), Ozzy Trapilo (Bears), Vederian Lowe (49ers) and Olisaemeka Udoh (Cardinals) received help at the highest rate among tackles. Of that group, only Trapilo managed a 90% pass block win rate or better, but he was also a rookie, which might explain the increased help.
As for big movers in the rankings, Abraham Lucas (Seahawks) and Trey Pipkins III (Chargers) are both viewed much more favorably now, while Darnell Wright (Bears) and Spencer Brown (Bills) dropped substantially. Check out the top 10 at offensive tackle, guard and center:

5. Which team ran twists and stunts the most?
The Rams — by a lot. Los Angeles ran twists or stunts on 47% of opponent pass plays, while no other team cleared 38%. But did it work for Los Angeles? It doesn’t really look like it.
The Rams sacked their opponents substantially less often while running a stunt or twist (5.8% vs. 8.6%), and they allowed virtually identical yards per pass attempt when opponents did get the ball out. They did force interceptions at a much higher rate (3.7% vs. 2.1%), though that could possibly be noise.
The Jaguars, who ran stunts and twists at the second-highest rate, had a 3.3% sack rate without twists or stunts but 6.3% with them.